The Kidney Failure Risk Equation
Find out your real risk of kidney failure

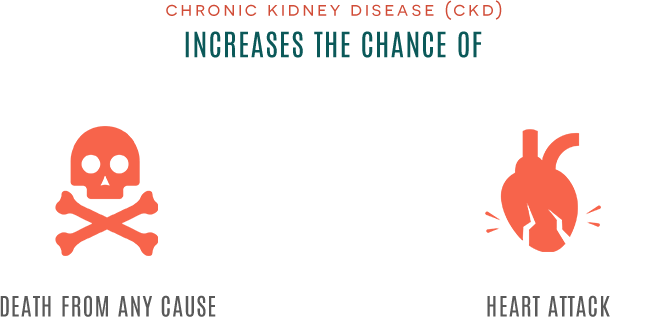
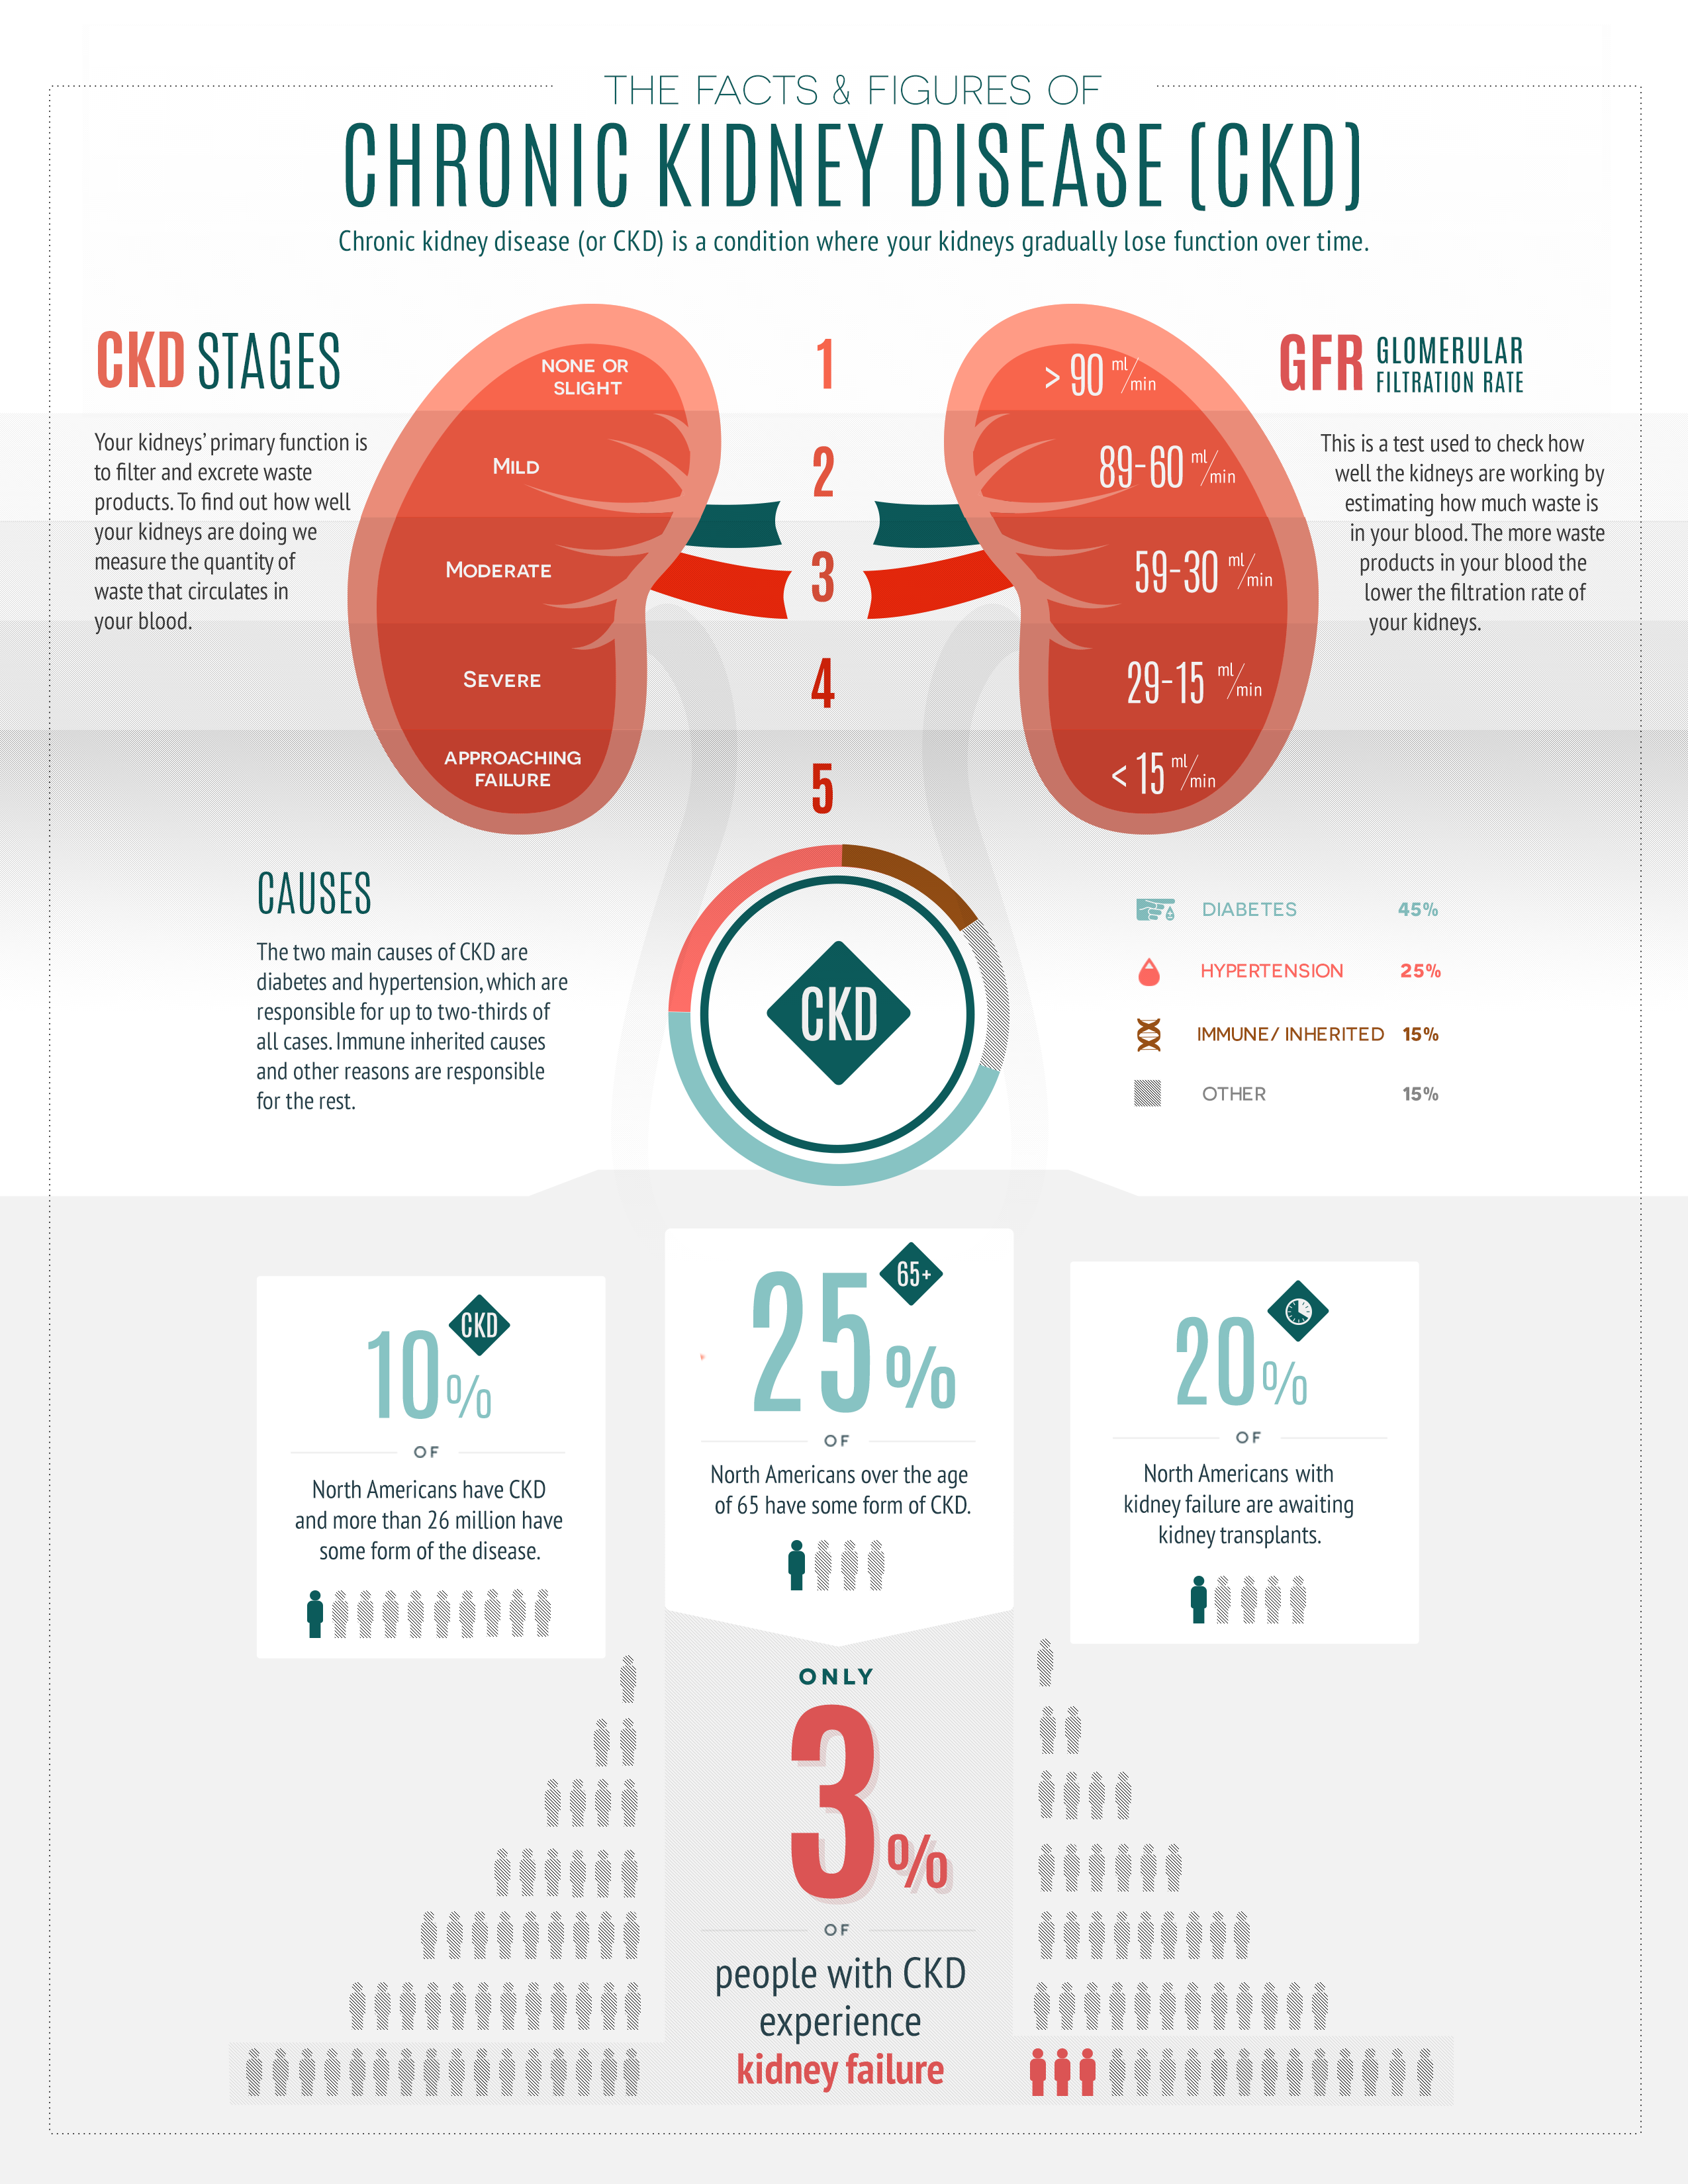
Facts & Figures of
Chronic Kidney Disease (CKD)

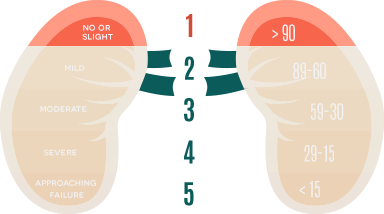
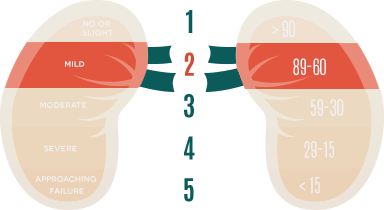
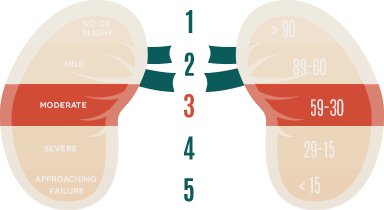
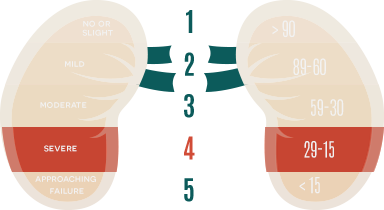
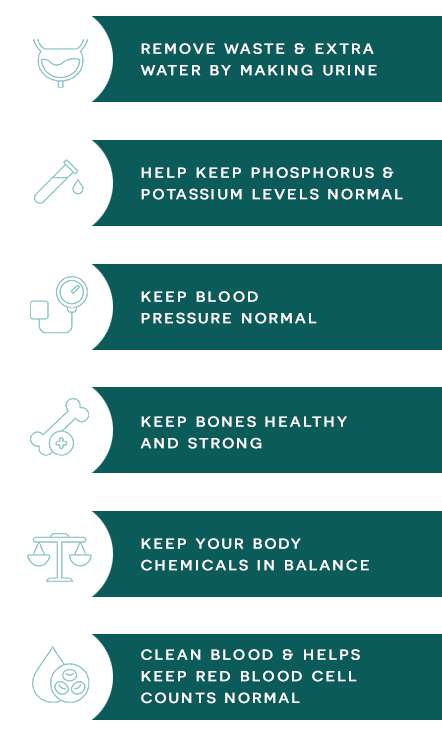
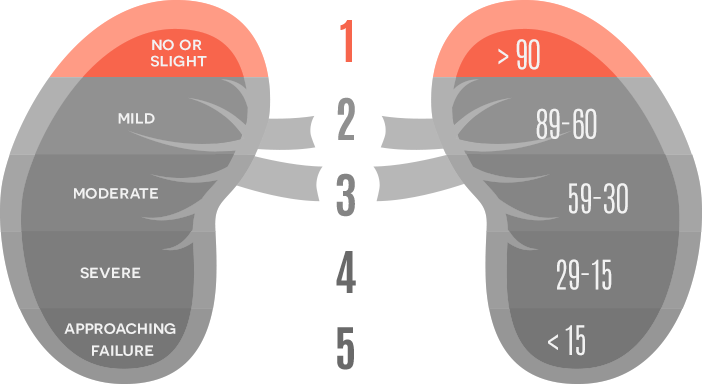
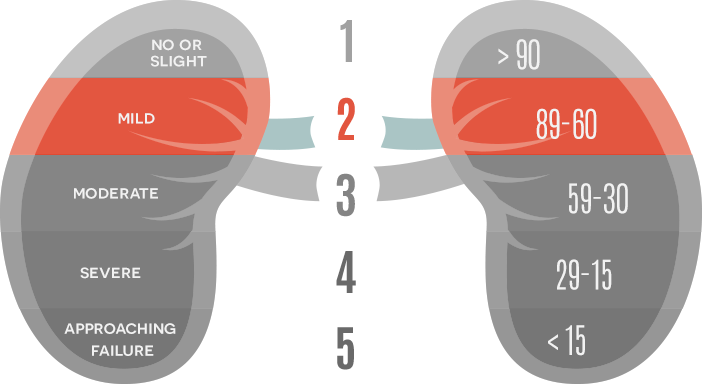
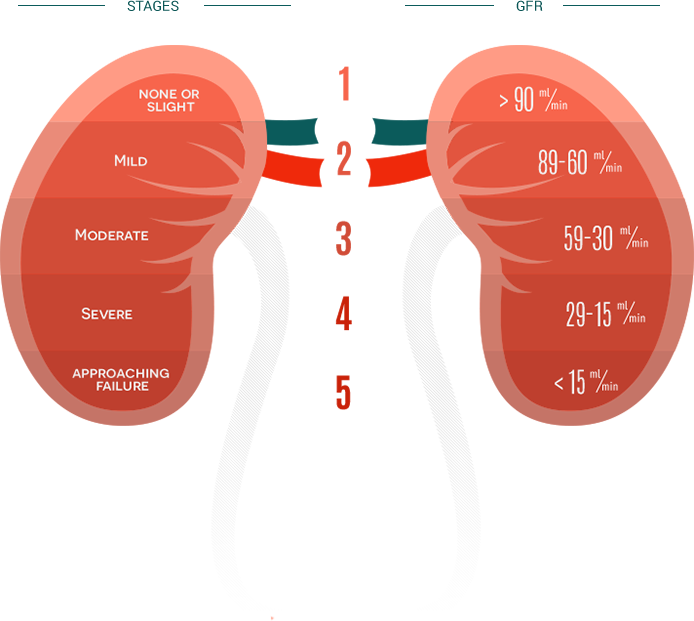
Your kidneys' primary function is to filter and excrete waste products. To find out how well your kidneys are doing, we measure the quantity of waste that circulates in your blood.

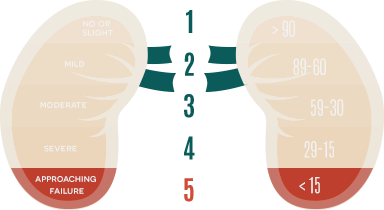
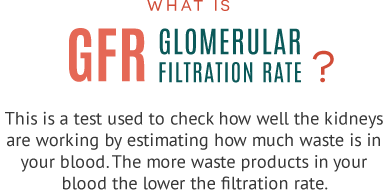
This is a test used to check how well the kidneys are working by estimating how much waste is in your blood. The more waste products in your blood the lower the filtration rate.
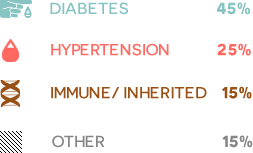
Causes
The two main causes of CKD are diabetes and hypertension, which are responsible for up to two-thirds of all cases.
Immune and inherited causes, as well as other reasons, are responsible for the rest.

Video Gallery
Chronic Kidney Disease
The following video provides more information on the main causes of CKD, infographics with statistics in North America and important information about Kidney Failure Risk.
Learn more about the patient experience
Different Risk Levels
The following videos provide additional information about different levels of Kidney Failure Risk.

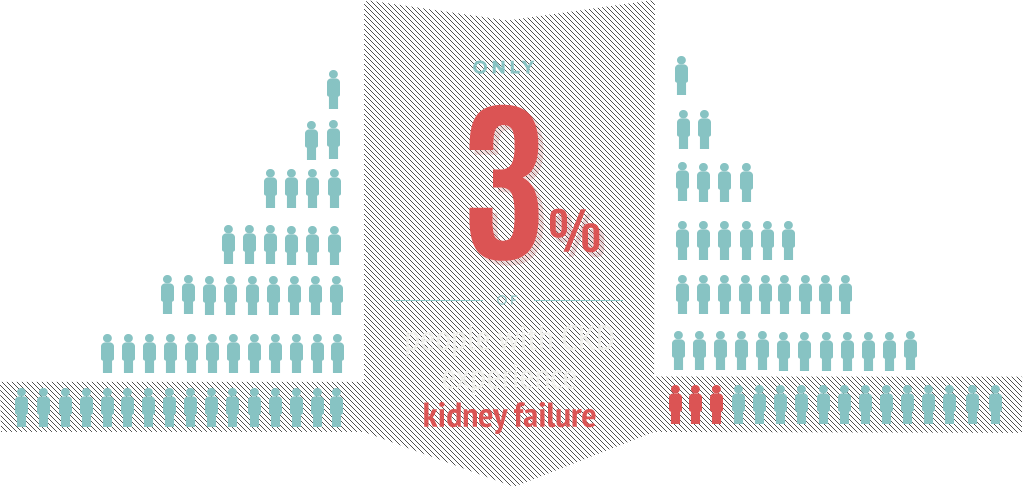
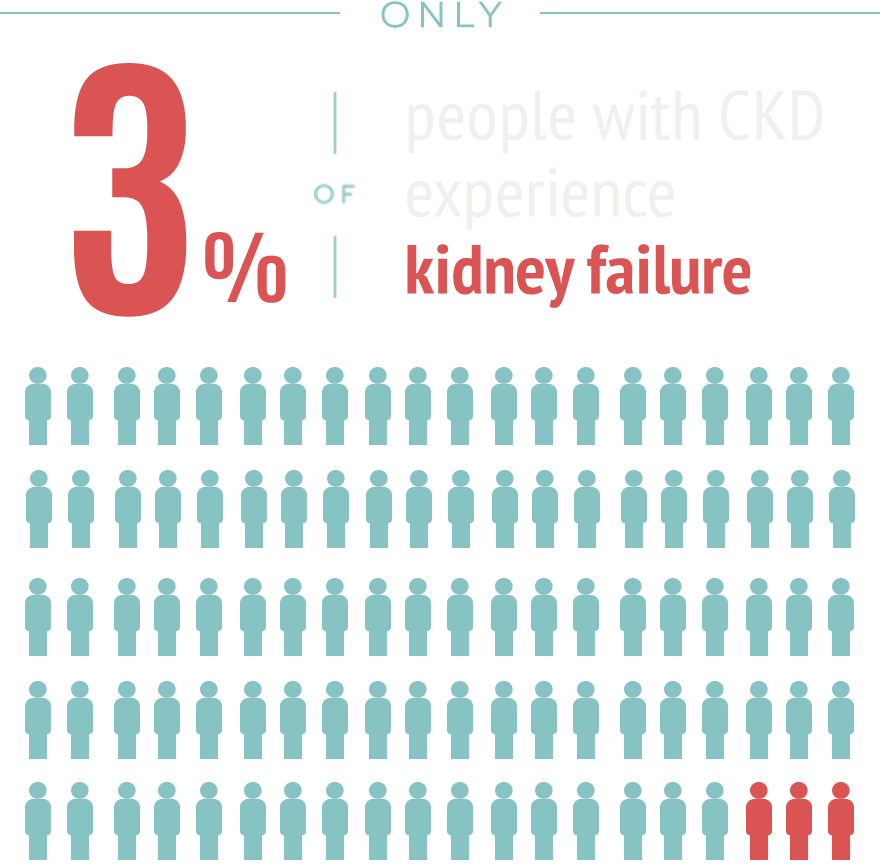
North Americans have CKD and more than 26 million have some form of the disease.

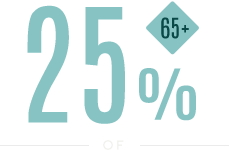

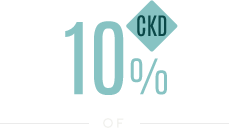
North Americans over the age of 65 have some form of CKD.


North Americans with kidney failure are currently awaiting kidney transplants.

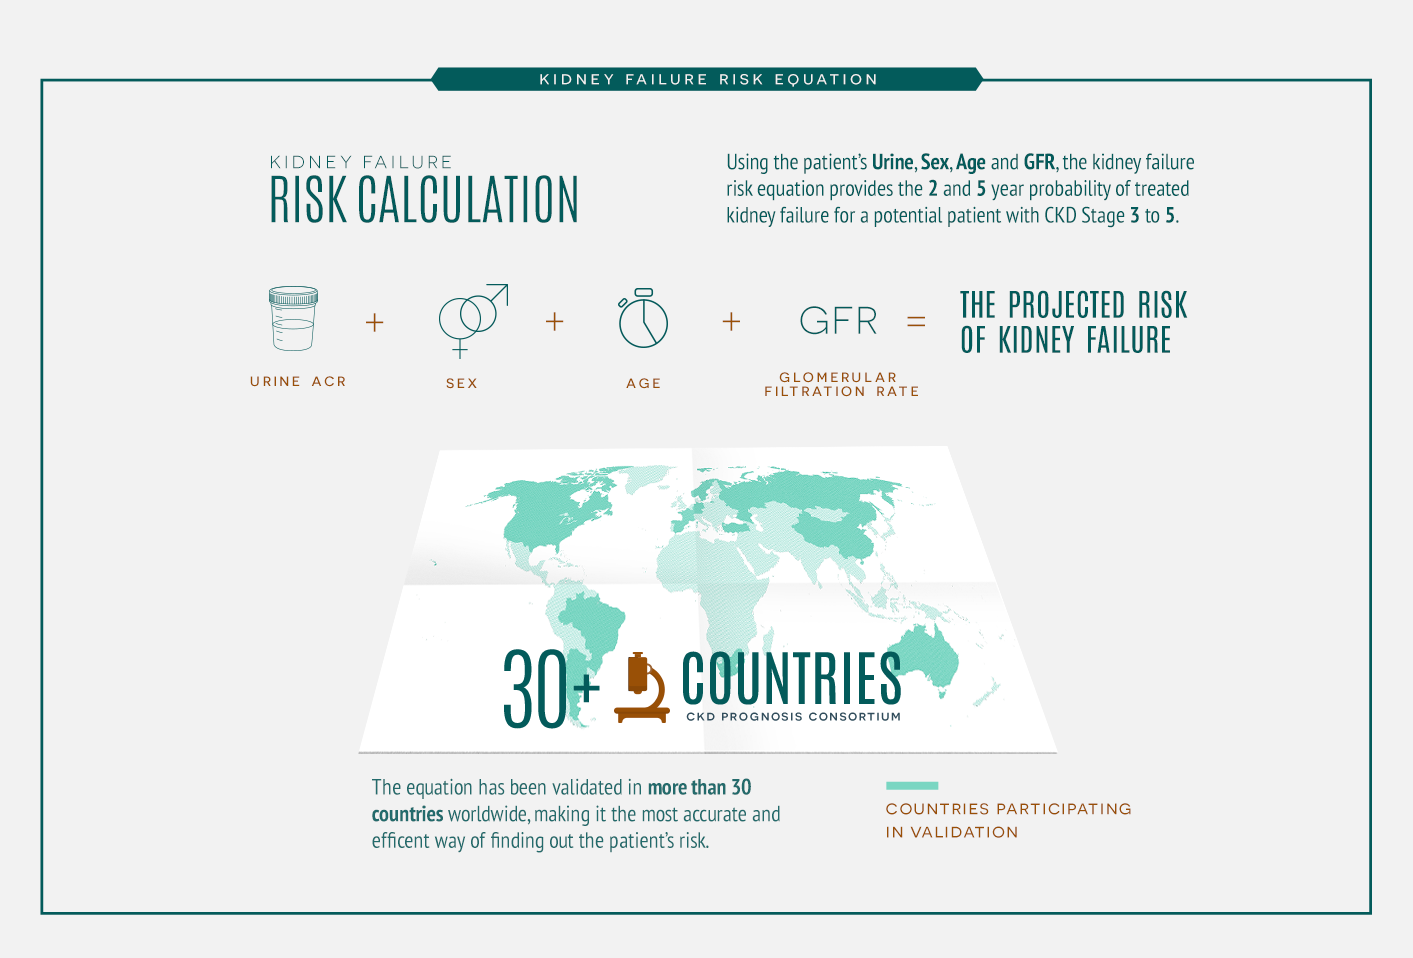
Kidney Failure Risk Equation
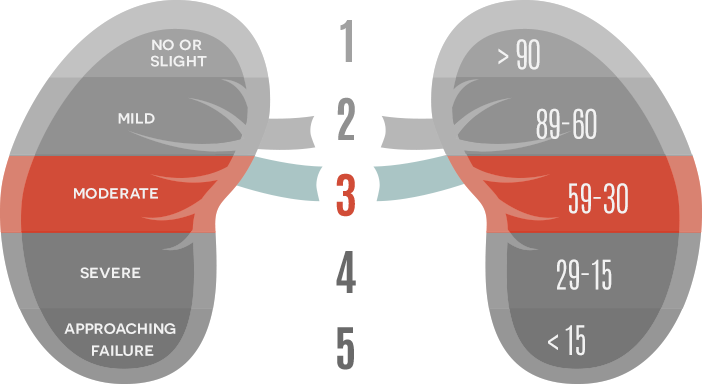
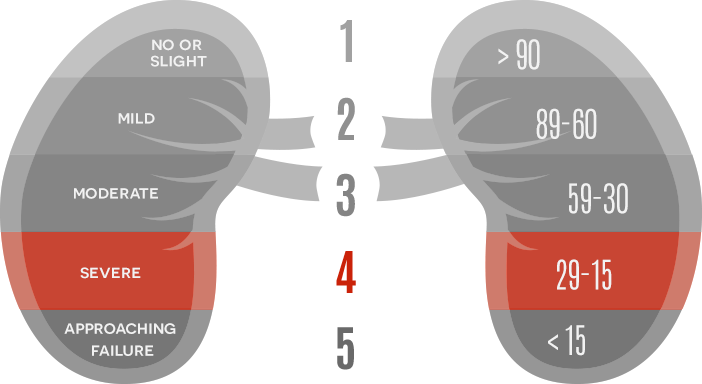
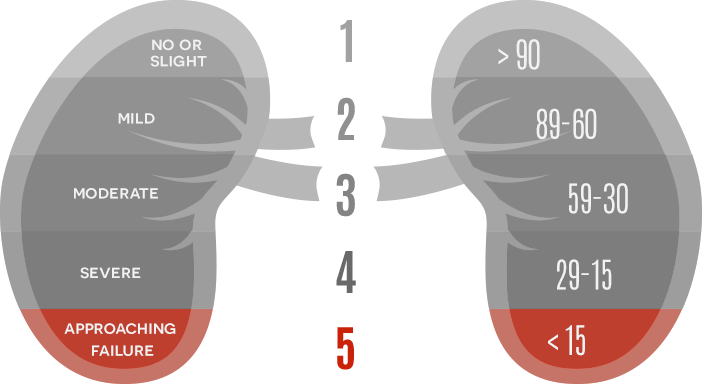
Using the patient's Urine, Sex, Age and GFR, the kidney failure risk equation provides the 2 and 5 year probability of treated kidney failure for a potential patient with CKD stage 3 to 5.
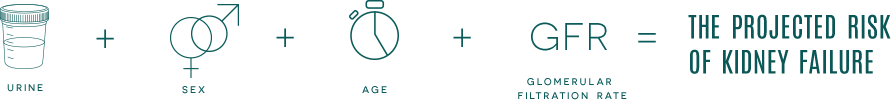
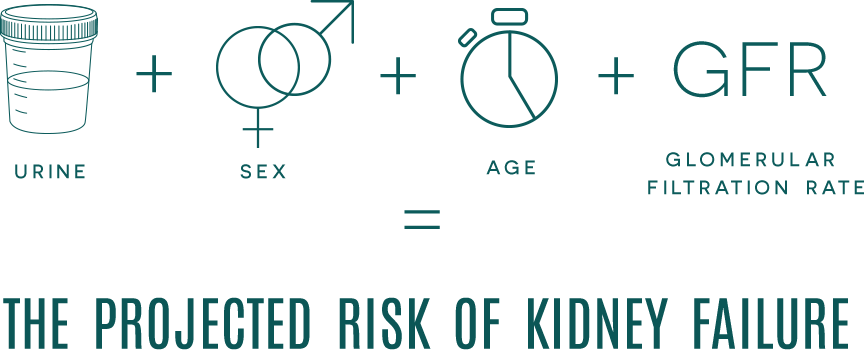
The equation has been validated in more than 30 countries worldwide, making it the most accurate and efficient way of finding out the patient's risk.


Want to learn more?
Download the Your Kidneys, Your Health Handbook to understand more about CKD.
Act Early on Kidney disease
The greatest benefits in years of dialysis prevented occur when we diagnose and treat kidney disease earlier.
Learn more about the benefits of early intervention by visiting
https://actearlyonkidney.com/